Knowledge Maps
By clicking on a map or diagram thumbnail below, you can access an interactive graphic overview on tools, books, researchers in different visualization fields, as well as on key success factors of visualization and cognitive biases to be aware of. There is also an interactive organizing table that shows (incl. examples) one hundred visualization-based methods.
Clicking on a particular tool, book, person, document, principle or method within a map opens the respective website or homepage in a new browser window or reveals an example.
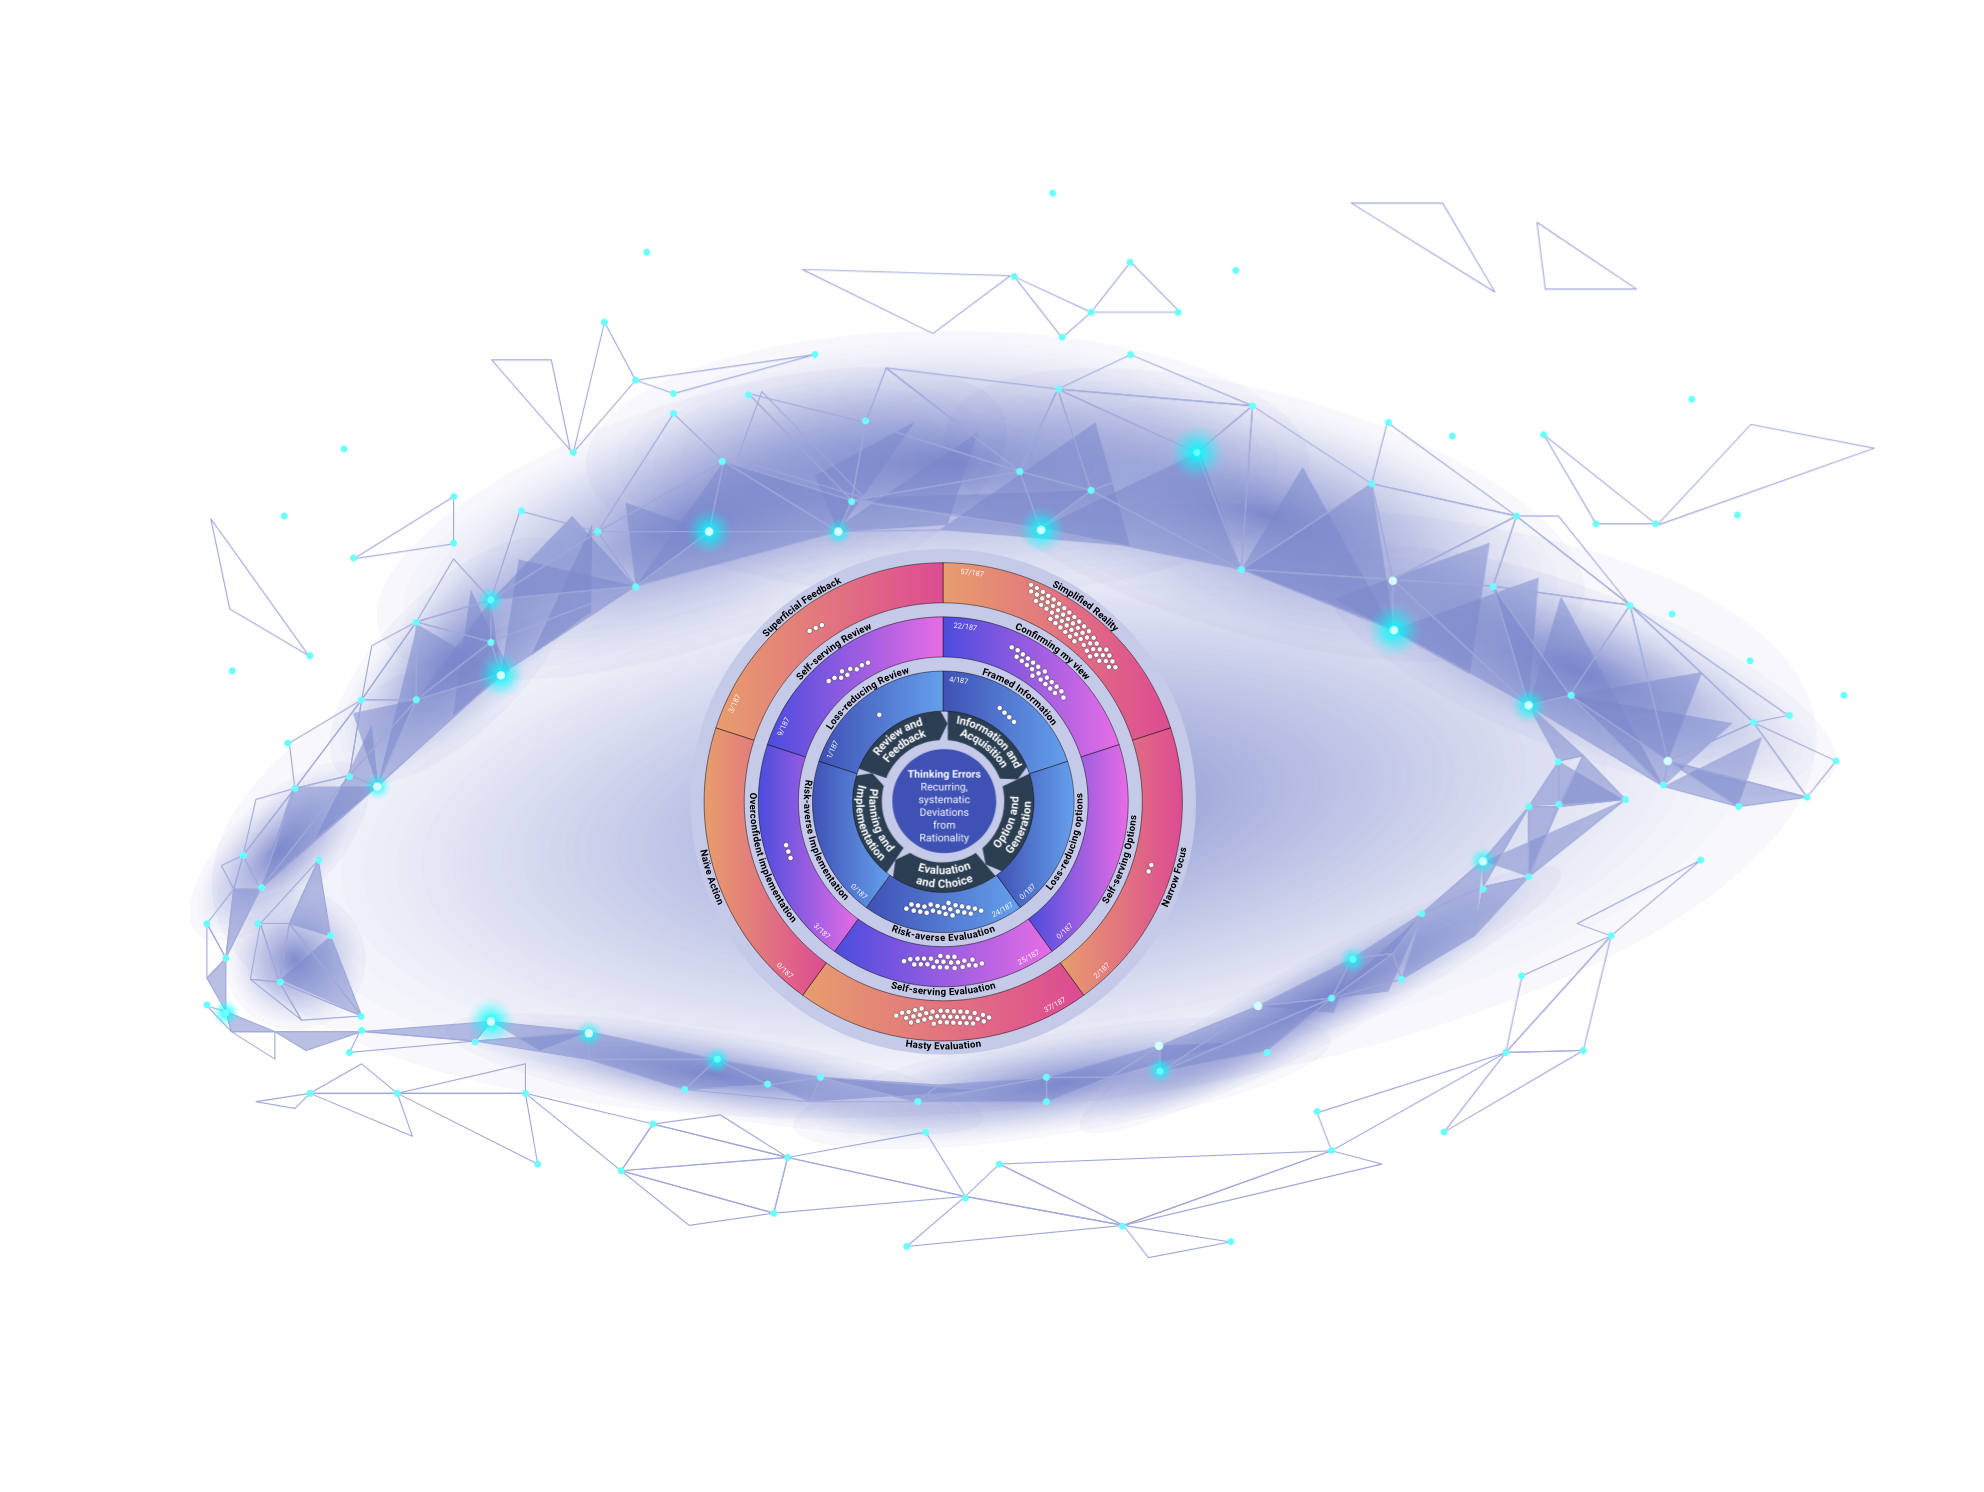
A map of cognitive biases in decision making
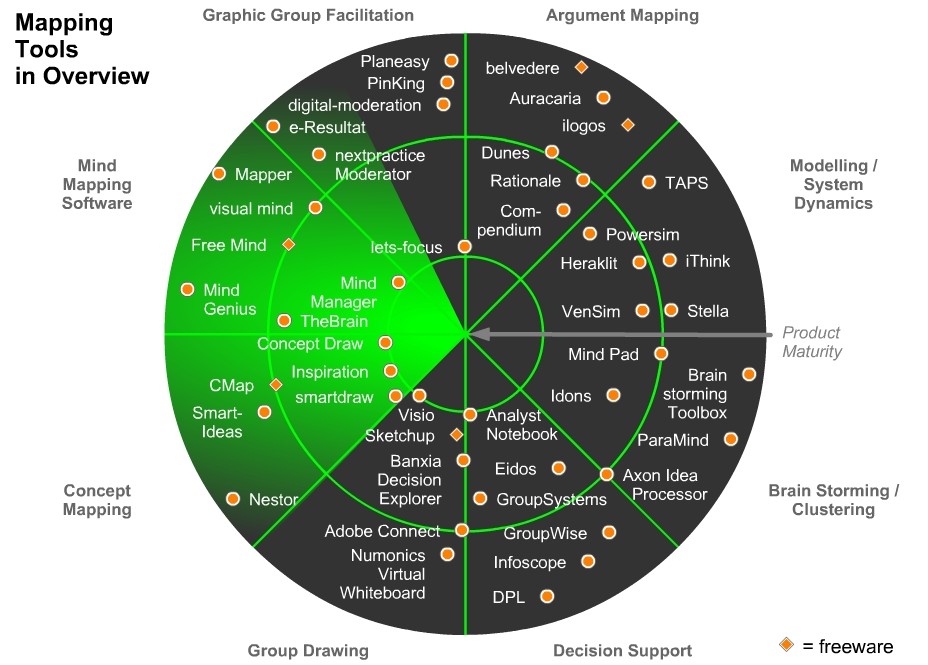
Visualization Software: Mapping Tools in Overview
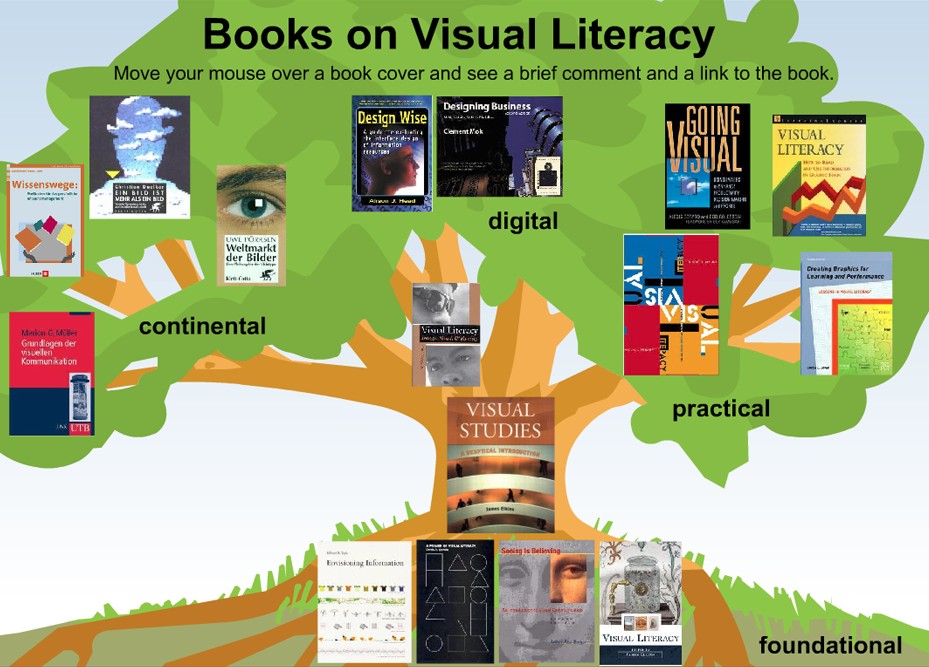
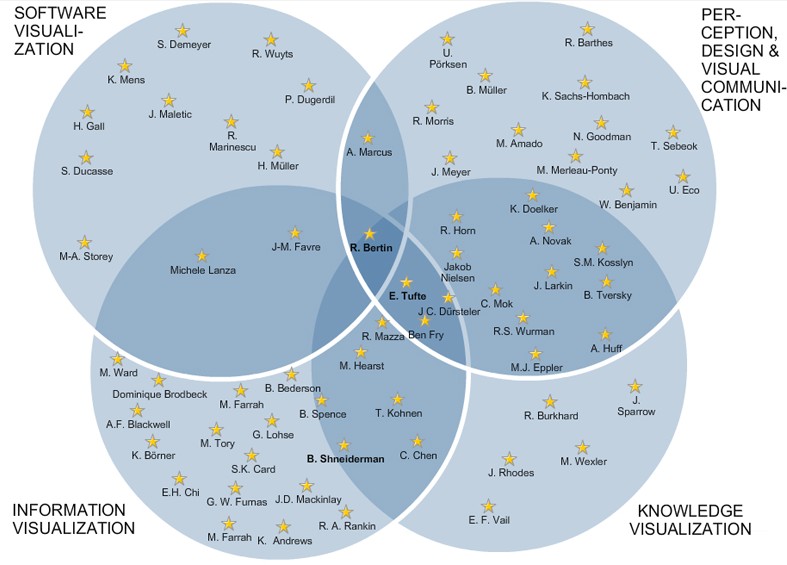
Books on Visual Literacy
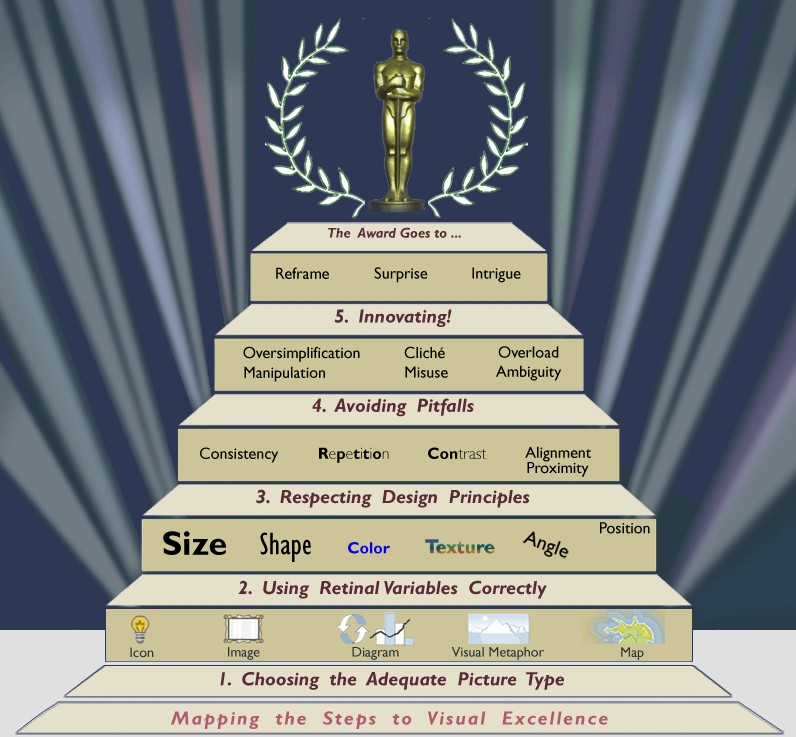
Stairs to visual excellence
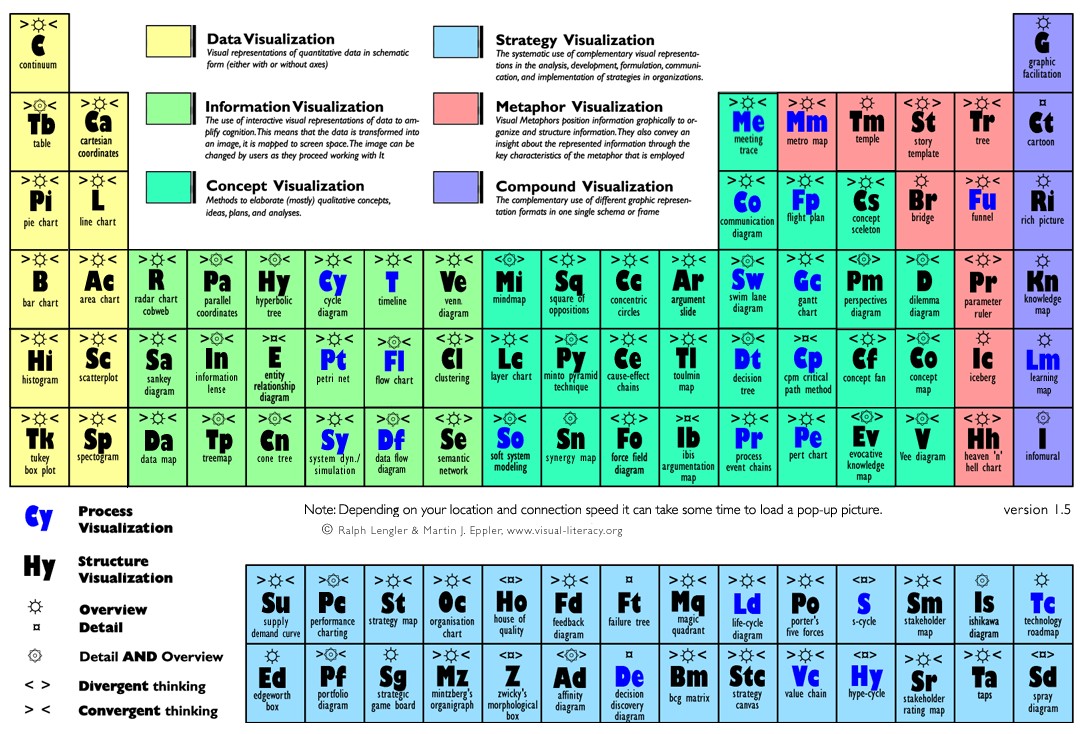
"Towards A Periodic Table of Visualization Methods for Management"
Lengler R., Eppler M. (2007). Towards A Periodic Table of Visualization Methods for Management. IASTED Proceedings of the Conference on Graphics and Visualization in Engineering (GVE 2007), Clearwater, Florida, USA.
Download version 1.5 of the periodic table as PDF
Chris Wallace has implemented an XML page on which you can see and print the mouseover pictures individually. More information
On another page by Chris you can group the visualization methods by your criteria and you can find background information for a specific visualization method via 'Google Images' and 'Wikipedia'. More information
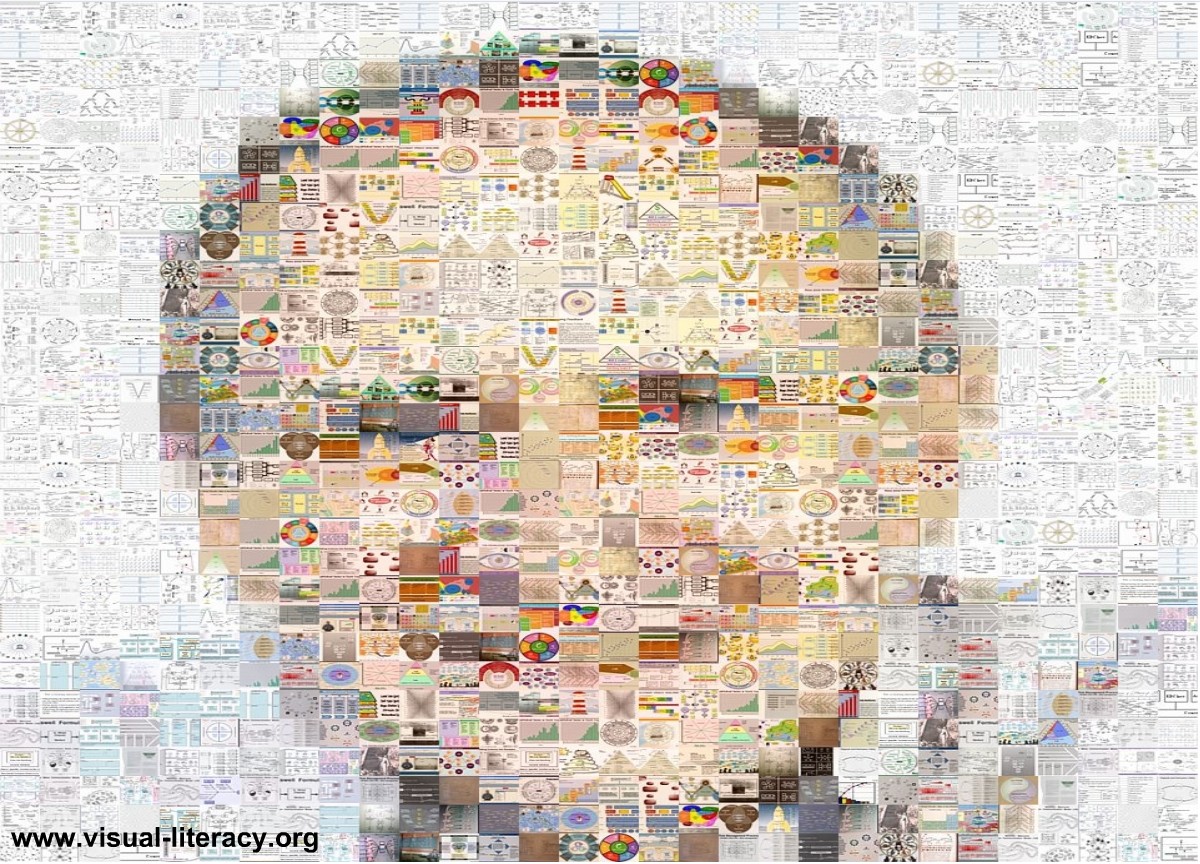
August 21st 2008 marks the 61st birthday of the great Ben Shneiderman, for many the father of information visualization. So we asked ourselves:
Why not use the head that wrote the book on the user interface and on information visualization as a user interface to information visualization formats?
So we created this meta-visualization as an homage to Ben Shneiderman, who would of course not approve of it, as it has not been user-tested or evaluated scientifically.
The portrait photo of Ben Shneiderman above is made out of almost a thousand thumbnail pictures of different visualization formats, such as diagrams, charts, maps, tables, or visual metaphors (found on the web, in books, or created with lets-focus). In compiling this variety of visualizations, we have tried to assemble an unusual mix of contemporary and historic examples of representing information graphically.
Many of the thumbnail pictures contain hot spots that reveal explanations as mouse-over comments or hyperlinks to related websites. Should you find errors in the explanations or links or if you have comments or suggestions, feel free to e-mail us at visual-literacy.org.
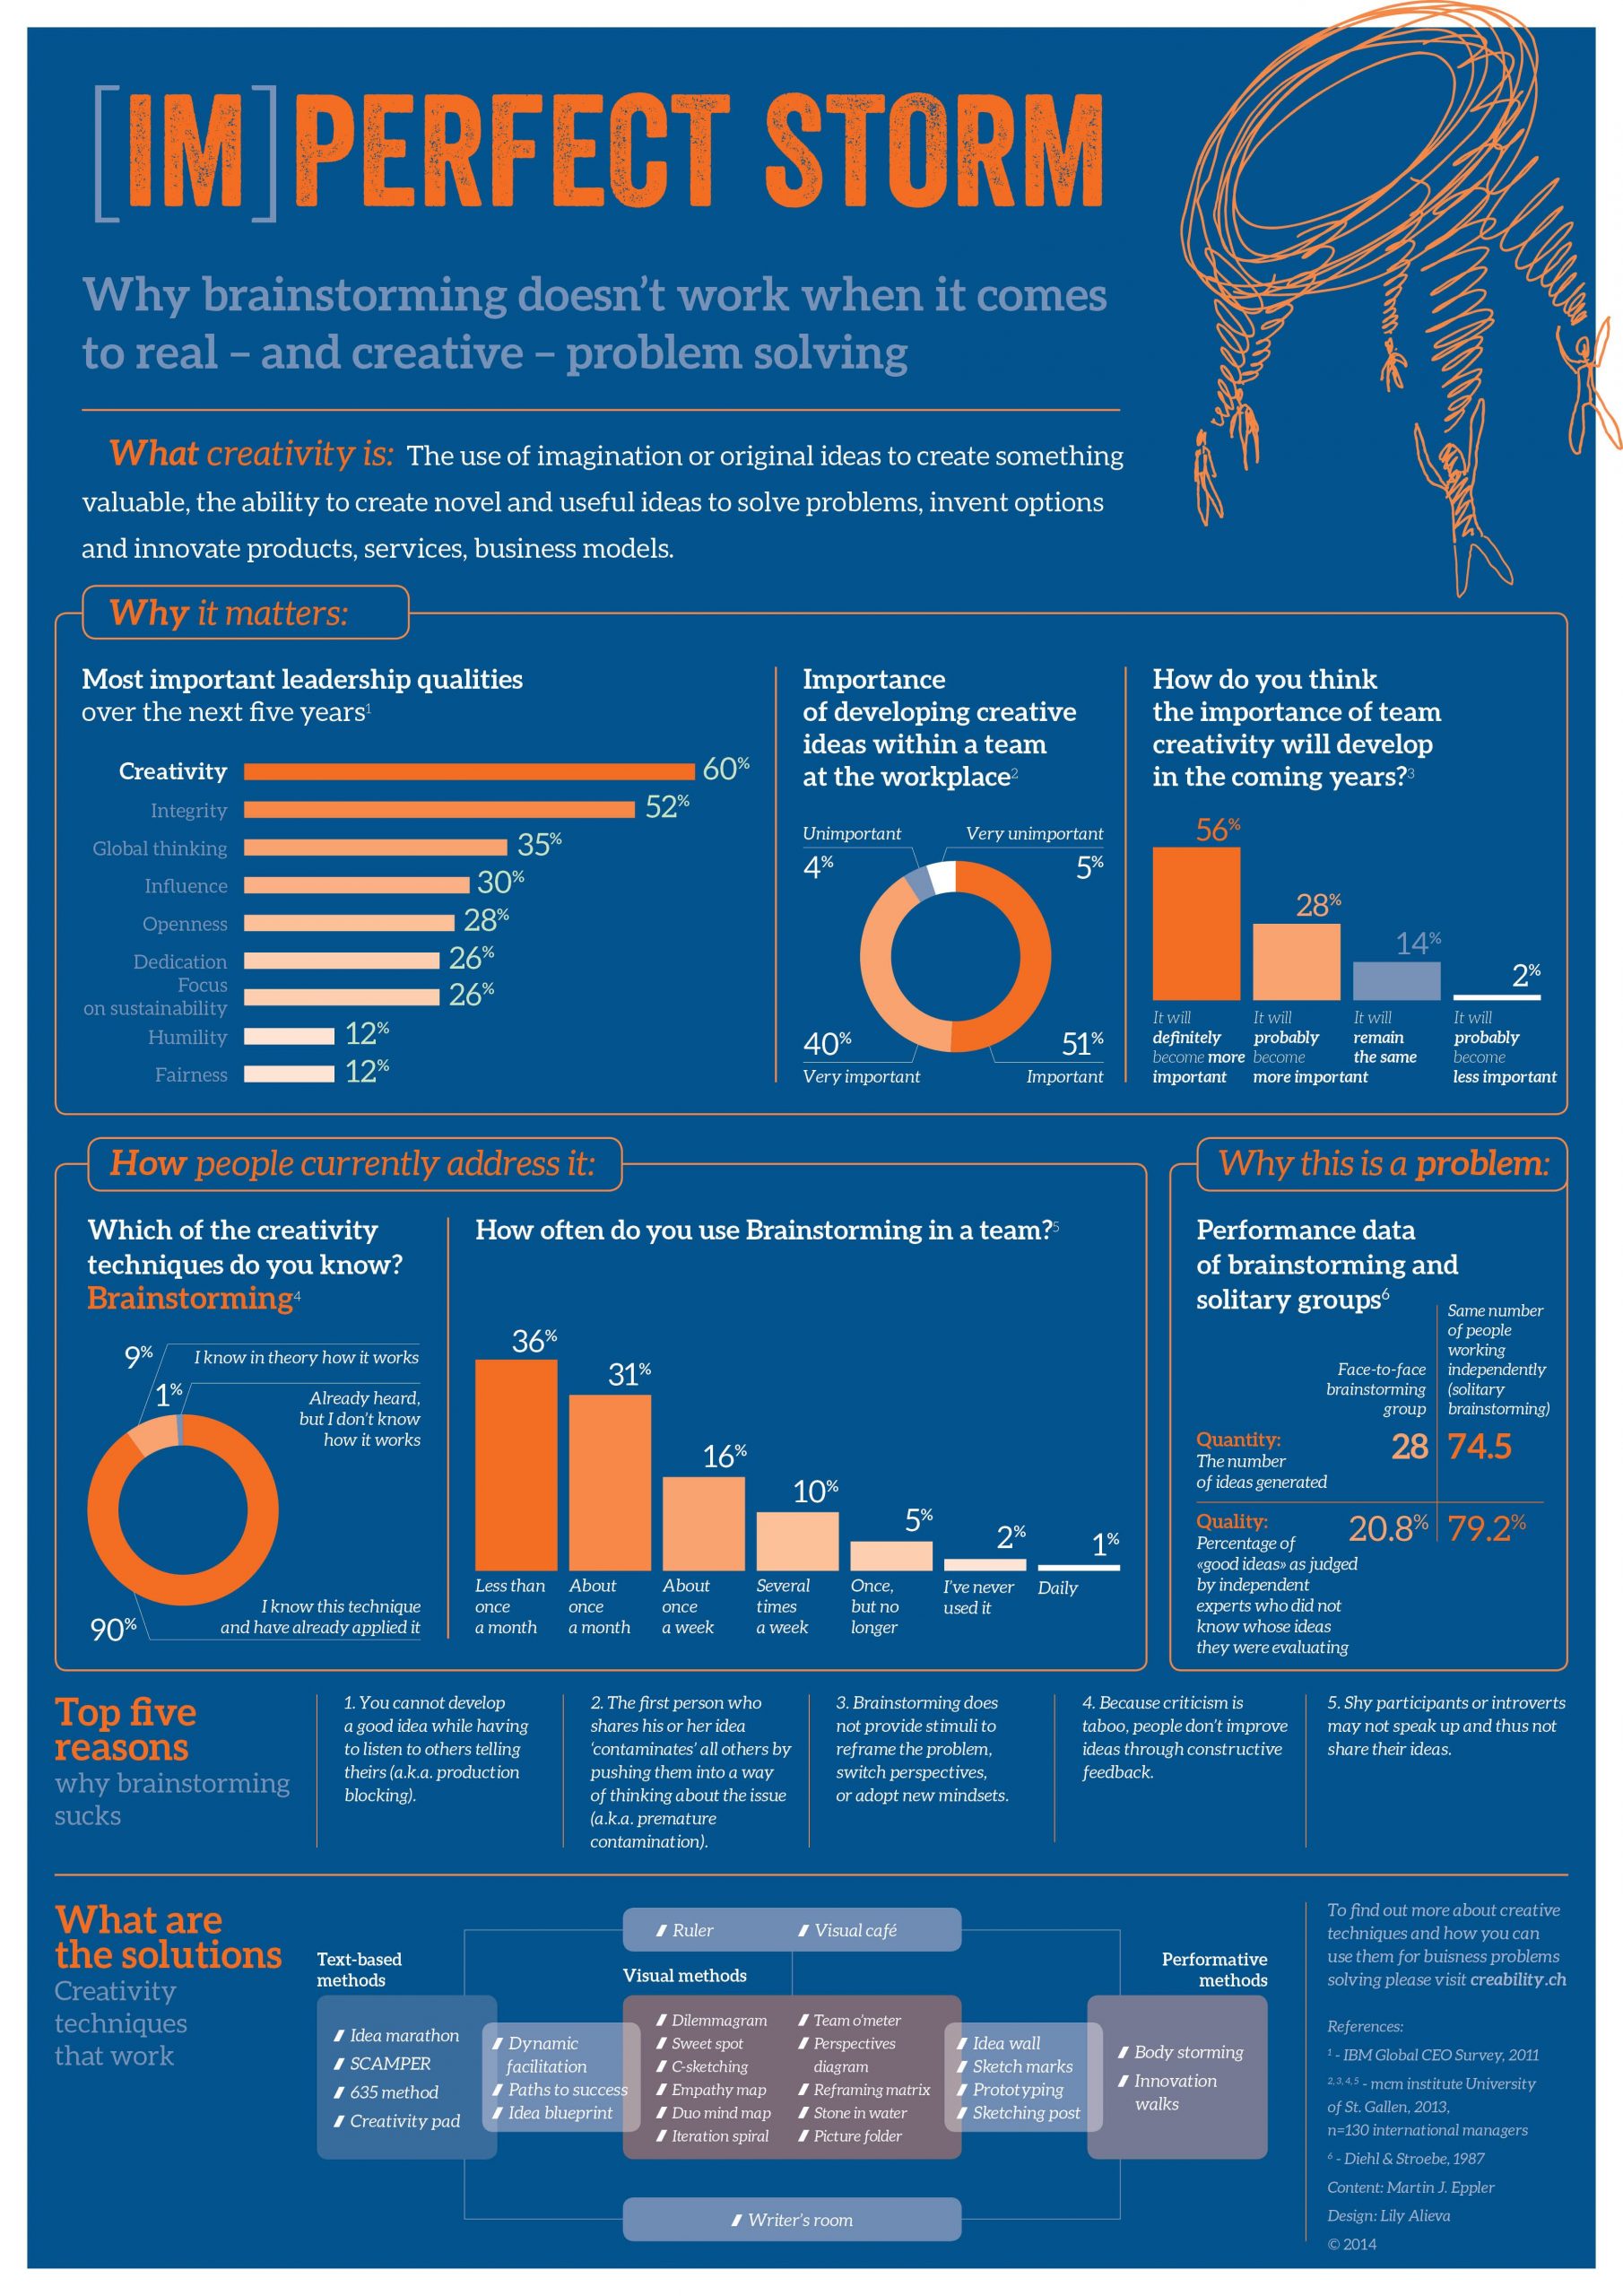
Imperfect Storm (click the image to enlarge)